
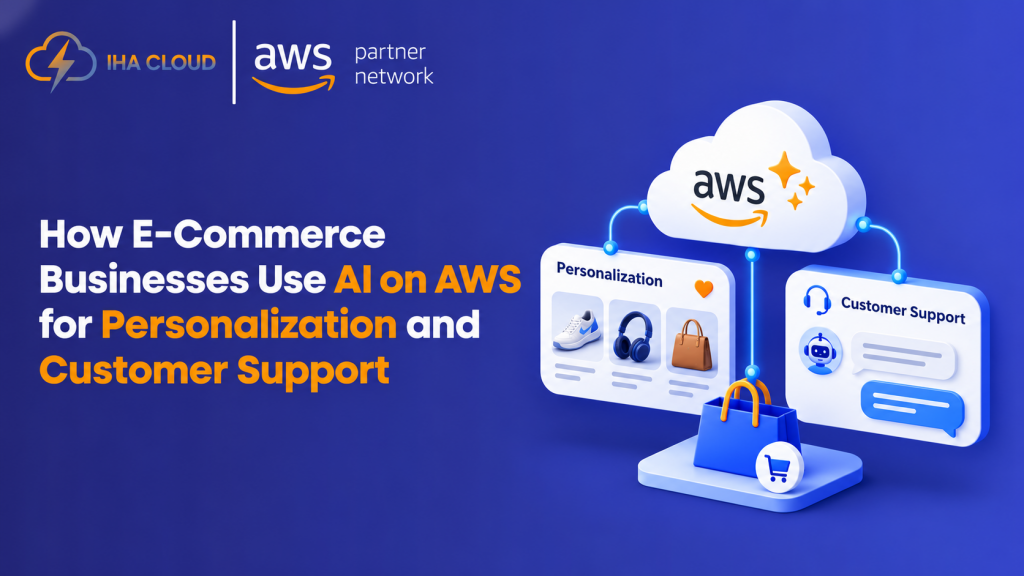
How E-Commerce Businesses Use AI on AWS for Personalization and Customer Support
Online shopping has changed the way customers discover products, compare prices, and interact with brands. Today, customers expect more than a website with a large product catalog. They want relevant recommendations, quick answers to their questions, and a smooth shopping experience from product discovery to checkout. For e-commerce businesses, delivering this experience to thousands of customers can be challenging. Product catalogs grow, customer inquiries increase during sales, and shopping behavior changes constantly. Artificial intelligence (AI) can help businesses manage these challenges by analyzing customer behavior, personalizing product discovery, and automating parts of customer support. With Amazon Web Services (AWS), e-commerce businesses can build AI-powered capabilities using cloud infrastructure and managed services without having to develop every component from scratch. Let’s explore how AI on AWS can improve personalization and customer support for online stores. 1. Personalized Product Recommendations Every customer has different interests, preferences, and shopping habits. Showing the same products to every visitor may not deliver the best shopping experience. AI can help e-commerce businesses recommend products based on customer behavior, purchase history, product preferences, and other relevant signals. For example, if a customer frequently browses fitness equipment, an online store could highlight workout accessories, sportswear, or related products. A customer shopping for a laptop might receive recommendations for compatible accessories. AWS offers services that can support recommendation systems. Amazon Personalize allows businesses to build personalized recommendation experiences using their data. It can help generate relevant product recommendations and rank items for different customer experiences. Businesses can use these capabilities to improve: The effectiveness of these recommendations depends on data quality, customer consent, and how well the recommendation system fits the business. 2. AI-Powered Customer Support Customer support is another area where AI can make a meaningful difference. Online stores receive recurring questions about order status, delivery estimates, returns, refunds, product availability, and payment issues. Handling every request manually can increase response times and workload. Generative AI can help businesses create customer support assistants that answer common questions using approved company information. For example, an online electronics store could offer an assistant that explains product specifications, compares compatible accessories, and answers questions about its return policy. Amazon Bedrock provides access to foundation models that businesses can use to build generative AI applications, including customer support assistants. A support assistant can be designed to: For order-specific requests, the assistant can also connect to authorized business systems through application APIs. This allows it to retrieve relevant order information rather than relying on general model knowledge. However, actions such as issuing refunds or changing delivery addresses should follow appropriate authentication, business rules, and approval processes. 3. Smarter Product Search Customers do not always search for products using the exact words found in a product catalog. Someone might search for “comfortable shoes for long walks” instead of a particular shoe category. Another customer might search for “a laptop for video editing under my budget.” Traditional keyword search may struggle to interpret the intent behind these queries. AI-powered search can help customers find relevant products by considering meaning, product attributes, and the context of a query. For example, an e-commerce business can use embeddings and vector search to match natural-language queries with product descriptions and other catalog information. Amazon Bedrock can support embedding-based applications, while Amazon OpenSearch Service can support vector search and retrieval. A well-designed search experience can help customers: Businesses still need to maintain accurate product descriptions, specifications, inventory information, and filters. AI search works best when it is supported by reliable catalog data. 4. AI for Product Descriptions and Catalog Management Managing thousands of product listings can be time-consuming, especially for online retailers that regularly add new products. Each listing may require a product description, feature summary, category, searchable attributes, and other information. Generative AI can assist with creating and organizing this content. For example, a retailer could provide structured product details and use an AI model to draft a product description in a consistent format. Another workflow could summarize technical specifications into simpler language for shoppers. With Amazon Bedrock, businesses can build applications that help with: These workflows can reduce repetitive content work, but generated content should be reviewed for accuracy, especially when it includes product compatibility, safety details, warranties, or technical specifications. AI should assist catalog teams rather than automatically publish unverified claims. 5. Handling Traffic Spikes During Sales Events E-commerce websites often experience sharp increases in traffic during festive sales, seasonal promotions, and special shopping events. These periods can put pressure on application servers, databases, product search, and customer support systems. AI features introduce additional considerations because model requests and recommendation workloads also consume resources. AWS provides cloud infrastructure and services that can help businesses design applications for changing workloads. Depending on the architecture, an e-commerce platform may use: Appropriate scaling, caching, load testing, and monitoring help businesses prepare for increased demand. For example, a store could cache frequently accessed product information, scale application resources according to demand, and set suitable limits on AI requests. AI services alone do not guarantee that an entire e-commerce platform will scale smoothly. The complete application architecture needs to be designed and tested for peak traffic. 6. Understanding Customer Feedback With AI Customer reviews, support conversations, survey responses, and product feedback can reveal what shoppers like and where they experience problems. However, analyzing large volumes of unstructured feedback manually can be difficult. AI can help summarize feedback and identify recurring themes across customer comments. For example, an online fashion retailer might discover that customers frequently mention sizing problems with a particular product line. An electronics retailer might identify recurring questions about battery life or device compatibility. Businesses can build workflows using Amazon Bedrock to summarize feedback, classify comments, and extract recurring themes. Potential use cases include: These insights can help product, marketing, and customer support teams prioritize improvements. Businesses should validate AI-generated summaries against the underlying feedback and avoid treating automated sentiment analysis as a perfect representation of customer opinion. 7. Keeping Customer Data Secure Personalization and AI-powered support often rely
How E-Commerce Businesses Use AI on AWS for Personalization and Customer Support Read More »