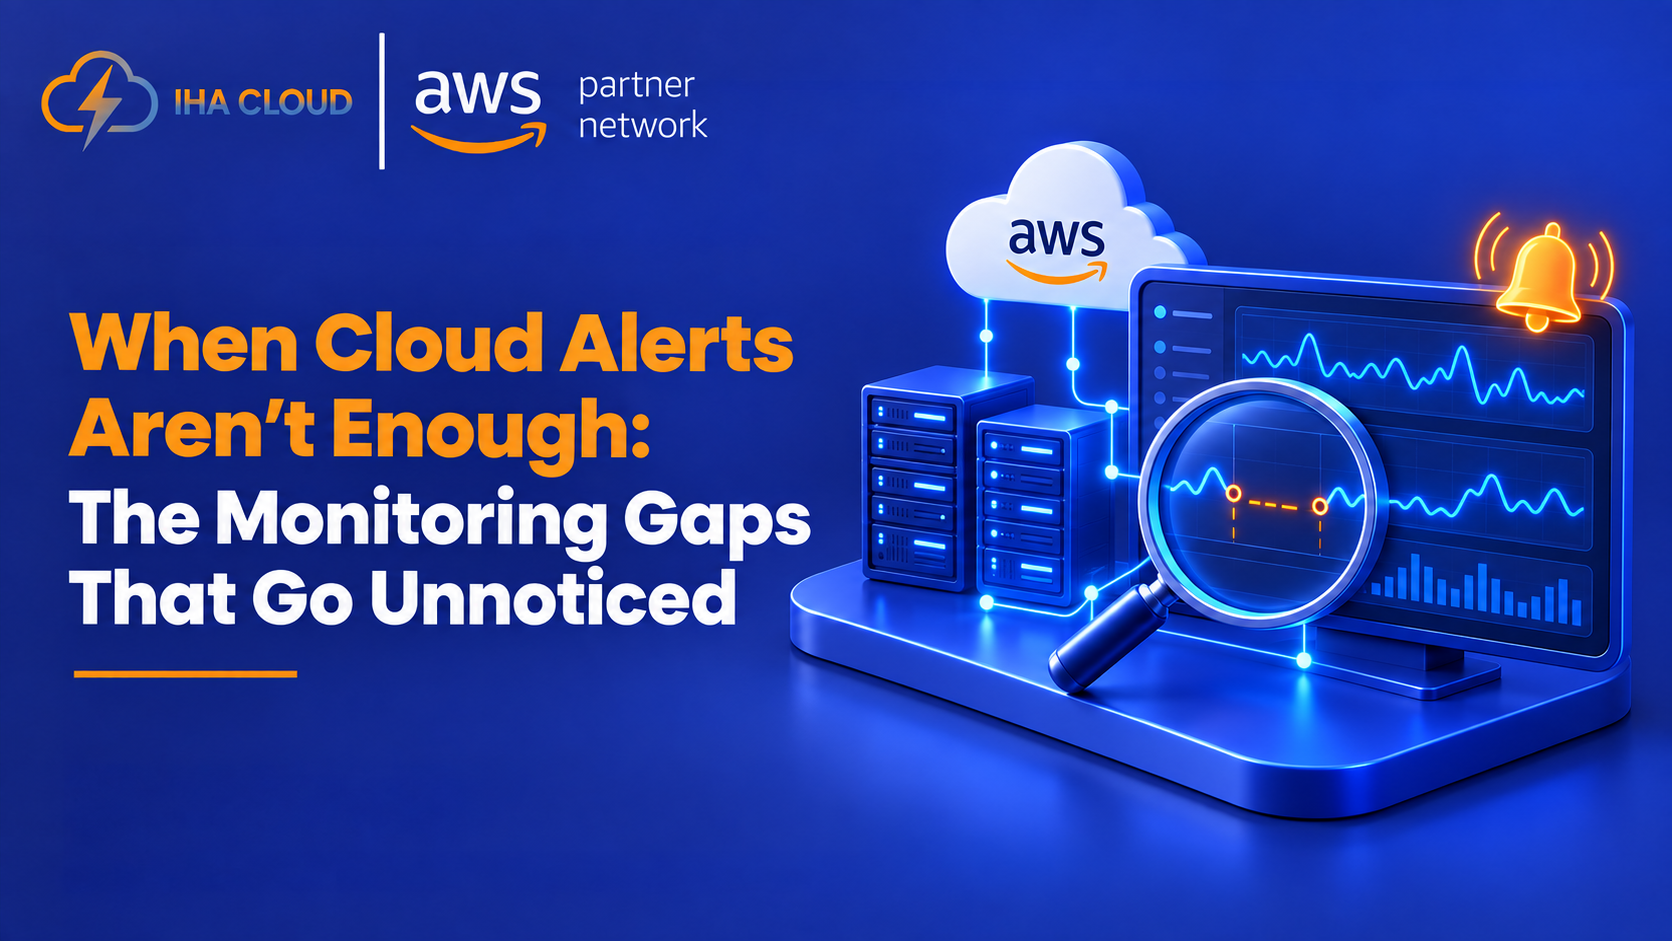
Your cloud can be sending alerts and still have problems you don’t see.
A server can look healthy while an application is failing. A job can report success while delivering incomplete data. A latency spike can tell you something changed without telling you what caused it.
The gap isn’t a lack of alerts. It’s relying on alerts without enough context.
Effective cloud monitoring should help teams detect meaningful changes, understand their impact, and investigate what is happening across infrastructure, applications, and dependencies.
What Are Common Cloud Monitoring Gaps?
Cloud monitoring gaps usually appear when teams focus on infrastructure thresholds but overlook application behavior, customer impact, dependencies, or business outcomes.
Common examples include:
- Application problems that don’t trigger infrastructure alerts
- Metrics that show a change without enough context to explain it
- Excessive alerts that create noise
- Silent failures that appear technically successful
- Problems hidden between interconnected services
These gaps can leave teams reacting to symptoms instead of understanding the problem.
1. Infrastructure Can Look Healthy While the Application Isn’t
One of the most common cloud monitoring gaps is focusing primarily on infrastructure health.
CPU, memory, disk, and network utilization are important, but application performance can degrade without those metrics reaching critical thresholds.
Consider an e-commerce application where a database query normally takes 100 milliseconds but suddenly takes 900 milliseconds. Server CPU remains at 55%, memory is stable, and disk utilization looks normal.
No infrastructure alert fires.
Customers, however, may experience slow pages or failed checkout requests.
That is why monitoring needs to include application and user-facing signals alongside infrastructure metrics.
2. Metrics Can Show What Changed, But Not Always Why
An alert can tell you that something changed. It doesn’t always tell you what caused the change or what happened elsewhere in the system.
Metrics are useful for identifying changes, but they often don’t provide enough context to explain the cause.
Logs can show the events surrounding a problem. Traces can show how requests move through distributed services and where time is being spent.
For example, an API latency alert may tell an engineer that response times increased.
Logs might reveal database connection errors.
A trace could show that requests are spending most of their time waiting on a downstream service.
Together, these signals provide more context than an alert alone. AWS recommends collecting application telemetry such as metrics, logs, and traces to understand workload behavior and troubleshoot problems.
3. Too Many Alerts Can Reduce Visibility
More alerts don’t necessarily mean better cloud monitoring.
When low-value alerts overwhelm meaningful signals, important problems can become harder to identify.
An alert that fires frequently but rarely requires action creates noise. Engineers then spend time filtering notifications instead of investigating problems that actually affect the system or its users.
The objective should be actionable alerts, not maximum alert volume.
A useful alert should indicate a meaningful problem and provide enough context to determine what requires attention.
4. Silent Failures Can Escape Traditional Alerts
Not every important failure produces an obvious error.
Imagine a scheduled data pipeline that completes successfully but processes significantly fewer records than expected.
The job status says successful.
Infrastructure metrics look normal.
Yet the business data is incomplete.
This is a monitoring gap because technical availability does not necessarily mean the business process succeeded.
Similar problems can include:
- Payments failing without an infrastructure outage
- Background jobs completing with incomplete data
- Orders failing to reach downstream systems
- APIs returning unexpected results
- Third-party dependencies degrading critical workflows
Monitoring application and business outcomes can expose failures that infrastructure alerts alone miss.
5. Problems Can Hide Between Cloud Services
Modern applications often depend on multiple interconnected services.
A single customer request might pass through a load balancer, application service, API, database, queue, authentication system, and third-party provider.
An alert from one component may not explain how the entire request was affected.
Distributed tracing helps close this gap by showing request paths across services and identifying where failures or latency occur. This is particularly useful when applications rely on microservices, containers, or multiple external dependencies.
How Should Cloud Monitoring Be Structured?
Better cloud monitoring doesn’t mean creating an alert for everything.
Each monitoring layer should answer a different question:
| Monitoring layer | Question it should answer |
| Infrastructure | Is the environment healthy? |
| Application | Is the application behaving normally? |
| Logs | What happened around the problem? |
| Traces | Where did the request slow down or fail? |
| Business signals | Did the intended customer or business outcome succeed? |
The purpose is not to collect every possible signal. It is to create enough context to move from detection to diagnosis without relying on a single metric or alert.
What Better Cloud Monitoring Looks Like
Better monitoring should make it easier to answer three operational questions:
What is happening?
What is affected?
Why is it happening?
When monitoring only tells you that something crossed a threshold, important problems can remain hidden.
Sometimes the most important cloud problem is the one that never triggered an alert.