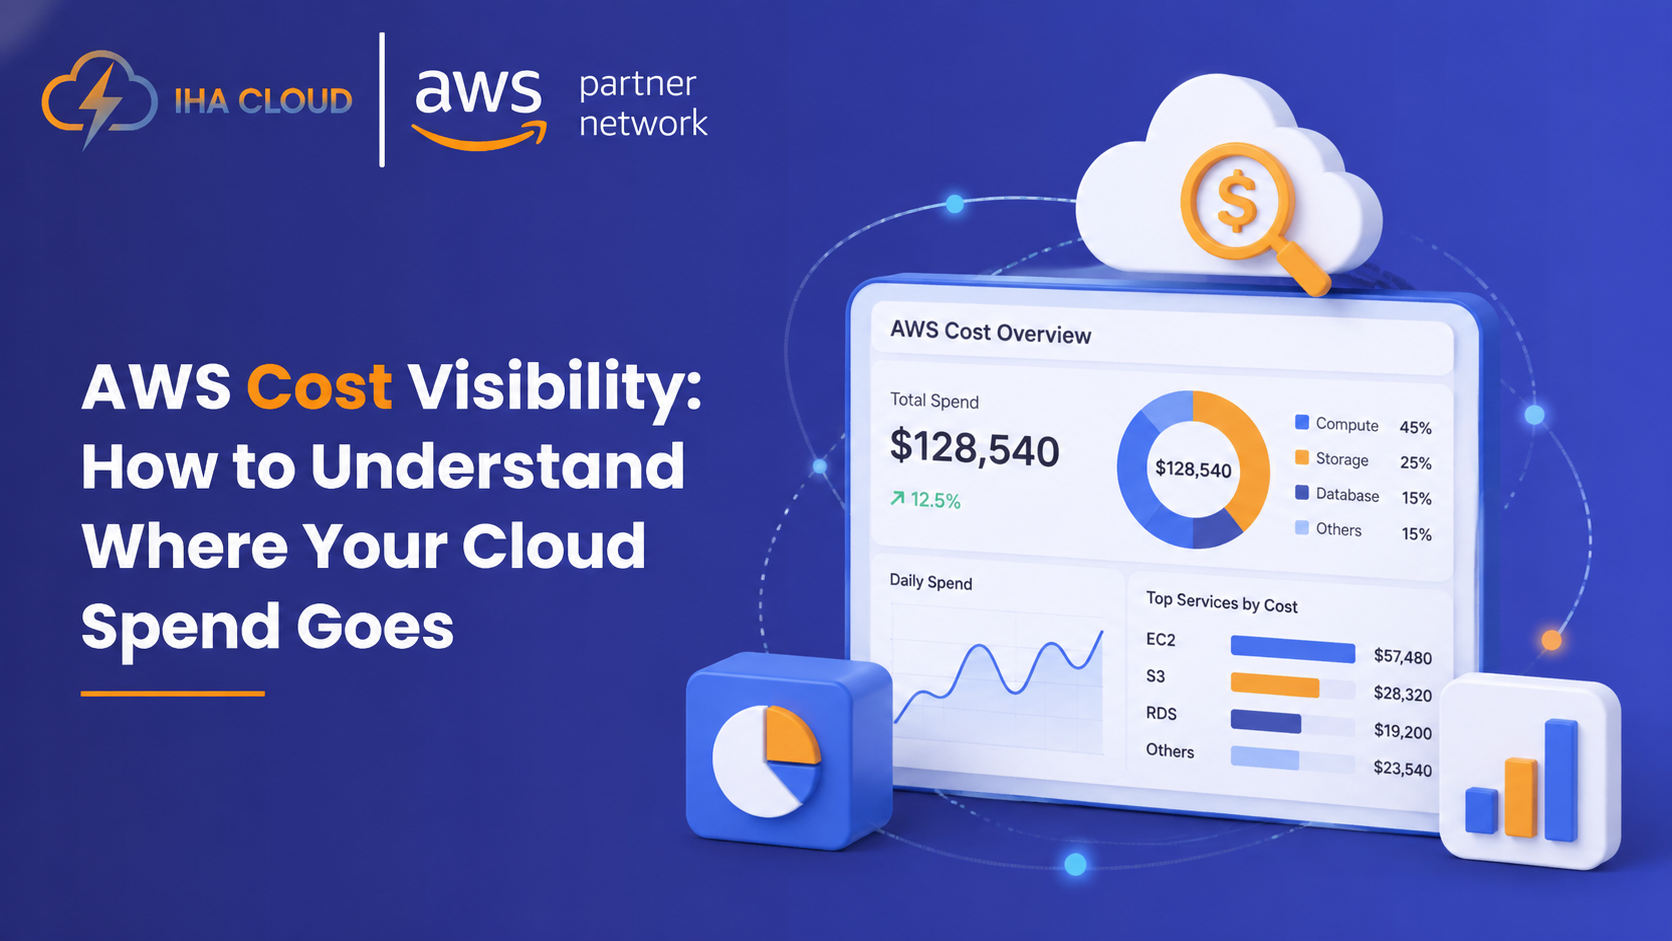
A higher AWS bill isn’t necessarily bad. An AWS bill you can’t explain is.
Your AWS bill went up 25% this month.
Was it because your application grew? Did a new workload go live? Did data transfer increase? Or are you paying for resources no one is using?
For many growing AWS environments, getting the total bill is easy. Understanding what is behind it is harder. [How to Read Your AWS Bill] explains how AWS billing information can be broken down into individual charges and usage types
That’s where AWS cost visibility matters. It helps engineering, finance, and leadership teams understand what is driving cloud spend and whether that spending supports the business.
What Is AWS Cost Visibility?
AWS cost visibility is the ability to understand how cloud spending is distributed across accounts, services, workloads, teams, applications, and business outcomes.
A useful strategy should answer four questions:
- Where is the money being spent?
- What is driving the cost?
- Why did it change?
- What value is that spending creating?
For example, a $5,000 increase in EC2 spending tells you that costs went up. Discovering that the increase came from a production application whose traffic grew 40% tells you why.
If revenue from that application grew at the same time, the higher cost may be entirely reasonable.
The point isn’t to react to a bigger number. It’s to understand what changed before deciding what to do about it.
Why AWS Cost Visibility Gets Harder as You Scale
AWS environments rarely stay simple.
A company might start with a few EC2 instances and an RDS database. Later, it may have separate accounts for production, development, analytics, security, and experimentation across multiple Regions.
Then come containers, data pipelines, monitoring, storage, networking, and AI workloads.
The infrastructure isn’t necessarily poorly managed. There is simply more of it, making it harder to connect an AWS charge with the application, team, or business function responsible for it.
AWS provides several ways to improve cost attribution. Account tags can associate account-level spending with structures such as business units, projects, cost centers, and environments, while resource cost allocation tags can connect spending with applications, owners, and workloads. These approaches can work together to improve cost attribution.
Your infrastructure may be organized. Your costs need the same level of organization.
A 5-Layer Approach to AWS Cost Visibility
The goal is to move from where money is spent to what that spending achieves.
1. Account: Where is the money going?
Start with your AWS accounts.
If production represents 70% of your AWS spending and development represents another 15%, you immediately know where most of the budget sits.
For multi-account environments using AWS Organizations, this provides a useful starting point for comparing environments and business units.
Account-level analysis tells you where to investigate. It doesn’t necessarily explain what is driving the cost.
2. Service: What is consuming the budget?
Now examine individual AWS services.
Consider this illustrative example:
| AWS Service | Monthly Spend | Change |
| Amazon EC2 | $18,000 | +12% |
| Amazon RDS | $7,500 | +18% |
| Amazon S3 | $4,000 | +6% |
| Data Transfer charges | $3,500 | +35% |
The largest cost isn’t always the most important one.
A 35% increase in data transfer charges could point to higher traffic, cross-Region communication, an architecture change, or another workload-specific factor.
AWS Cost Explorer helps teams group and filter cost and usage data across dimensions such as services, accounts, Regions, tags, and cost categories.
But service-level data still leaves one question:
Which workload is creating the cost?
3. Workload: What is driving the cost?
Resource-level attribution helps connect AWS spending with applications and teams.
For example:
Application = Payments
Environment = Production
Team = Platform
Once relevant cost allocation tags are activated, tagged resource costs can be analyzed through AWS cost-management tools.
Instead of:
“EC2 costs us $18,000 a month.”
you can ask:
“How much of that $18,000 supports Payments?”
That’s a much more useful starting point for engineering and FinOps teams.
The limitation is straightforward: inconsistent tagging creates inconsistent visibility. If resources aren’t tagged properly, some spending will remain difficult to attribute.
4. Business Group: Where does the spending belong?
AWS Cost Categories can group costs into business-oriented structures using defined rules and supported dimensions.
For example:
Engineering → Payments → Production
Cost Categories don’t automatically determine resource ownership. Instead, they provide a consistent way to organize spending for reporting, budgeting, and accountability.
This becomes especially useful when multiple teams share AWS infrastructure.
5. Business Outcome: What are you getting for the spend?
The final layer connects cloud costs with business performance.
Useful measures include:
- Cost per customer
- Cost per transaction
- Cost per API request
- Cost per workload
Suppose AWS spending rises 25%, but transaction volume rises 40%.
The higher bill may not indicate inefficiency.
Flexera’s 2026 State of the Cloud Report found that 49% of organizations now use unit economics to connect cloud costs with business outcomes, up from 40% in 2025.
The goal isn’t to make AWS spending as small as possible. It’s to understand the cost of delivering the outcome.
A Simple End-to-End Example
Consider a production Payments application:
AWS Account → Production
Service → Amazon EC2
Workload → Payments
Business Group → Engineering
Metric → Cost per transaction
Now the team can ask:
“Is the cost of running Payments increasing faster than the transaction volume it supports?”
That’s far more useful than simply asking whether the AWS bill increased.
It gives engineering and FinOps teams a common basis for deciding whether to optimize, investigate, or accept the additional spend.
When a Higher AWS Bill May Be Justified
Consider an illustrative scenario where your AWS bill increases by 28%.
You investigate and find:
- Production traffic increased 40%
- Revenue increased 32%
- EC2 spending increased 12%
- Database spending increased 18%
- Data transfer charges increased 35%
Some of that increase may simply reflect growth.
The data transfer increase, however, deserves investigation. It could come from cross-Region traffic, architectural changes, or increased data movement.
Visibility doesn’t tell you whether a cost is good or bad. It gives you the information needed to make that judgment.
How to Improve AWS Cost Visibility
You don’t need perfect visibility on day one. Start with the areas where better attribution will have the biggest impact:
- Define cost ownership across accounts, applications, teams, and business units.
- Standardize account and resource tagging for applications, environments, owners, and cost centers.
- Activate relevant cost allocation tags for cost analysis.
- Establish a baseline with Cost Explorer.
- Investigate meaningful changes by service, account, Region, and workload.
- Reduce unallocated spending by improving attribution.
- Track unit economics for important workloads.
- Review regularly as your AWS environment changes.
You don’t need to build a perfect cost model before taking action.
Start by making your largest and fastest-growing costs explainable.
Once you know where your AWS spending is going, the next step is deciding what to optimize. Our AWS Cost Optimization Checklist for 2026 covers practical ways to reduce waste, right-size infrastructure, manage commitments, and keep AWS costs under control.
From Cloud Spend to Better Decisions
You can’t optimize what you can’t explain.
A higher AWS bill could indicate waste. It could also reflect a successful product launch, growing traffic, or a workload delivering more business value.
Without visibility, those situations can look similar.
With better cost attribution, teams can identify what changed, understand what drove it, connect the spending to the relevant workload or business group, and decide whether the cost is justified.
AWS cost visibility isn’t about making every number smaller. It’s about making the important numbers understandable enough to support better technology and business decisions.