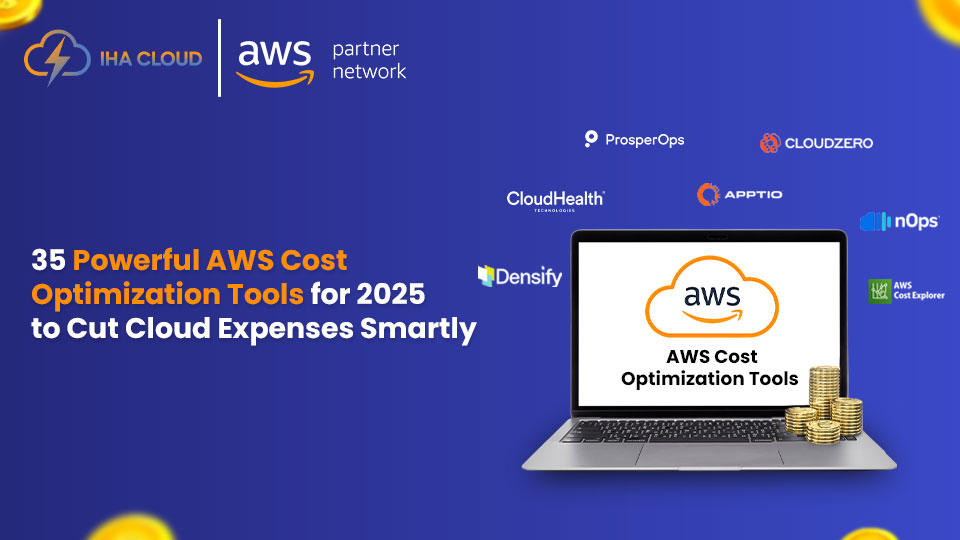
Top 35 AWS Cost Optimization Tools for 2026
Managing cloud expenses has become a major priority for businesses of every size. As more companies move their applications, data, and operations to AWS, it becomes easier for costs to grow without anyone noticing. Unused resources, oversized servers, old snapshots, and unpredictable workloads can quickly increase monthly bills. That’s why understanding the right cost optimization tools is so important in 2026. This detailed blog guide on Top 35 AWS Cost Optimization Tools for 2026 is designed to help you take full control of your cloud spending in a simple and practical way. Instead of complicated technical language, you’ll find clear explanations of each tool, what it does, and how it can help you save money. From monitoring tools that help you track your budget, to automation tools that stop idle resources, to advanced options like Spot Instances and Graviton processors, each one plays a role in reducing waste and increasing efficiency. Whether you manage a small AWS setup or a large multi-account cloud environment, these tools can help you understand where your money is going, cut unnecessary expenses, and improve the overall performance of your cloud workloads. With the right mix of visibility, automation, and smart planning, AWS cost optimization becomes much easier and more effective. This list gives you everything you need to get started in the right direction. What Is AWS Cost Optimization? AWS cost optimization is the continuous process of managing cloud resources in a smart and efficient way so that you only pay for what you actually need. It involves analyzing usage, understanding spending patterns, and applying strategies that keep your AWS bill under control without affecting performance. Why AWS Cost Optimization Matters When businesses scale, cloud expenses grow very fast if not managed properly. Without proper visibility, unused or oversized resources can silently increase costs. Cost optimization helps you: How to Approach AWS Cost Optimization 1. Understand Your Cloud Usage Start by reviewing consumption patterns across compute, storage, database, network, and serverless services. Identify peaks, unused components, or seasonal variations. Clear tagging and organized cost categories help simplify analysis. 2. Right-Size Your Resources Check if instances, databases, or storage volumes are larger than required. Adjust CPU, RAM, and storage to match real workload needs. Remove idle or rarely used resources and resize environments where possible. 3. Improve Storage Efficiency Different workloads need different storage classes. Move infrequently accessed data to cheaper storage tiers and use automated lifecycle rules to archive or delete old data. This prevents unnecessary long-term storage expenses. 4. Optimize Compute Spending Use flexible pricing models like commitment-based discounts, usage-based billing, and spare capacity options. Match the compute capacity to actual demand with auto scaling, scheduling, and efficient workload placement. 5. Automate Cost Controls Set up alerts for unusual spending, automate shutdown schedules for non-production systems, and use policies to maintain consistent configurations. Automation reduces manual oversight and keeps costs stable. 6. Use Serverless and On-Demand Services Wisely Serverless platforms charge only for actual usage, making them ideal for variable workloads. For steady, predictable workloads, capacity planning and commitment models offer significant savings. 7. Improve Resource Governance Establish clear tagging standards, create cost categories, and use shared billing structures to manage multiple accounts. Good governance prevents duplicate resources and improves visibility across teams. 8. Optimize Data Transfer and Networking Reduce cross-region traffic, use caching layers, and deliver content closer to users. This helps minimize high data transfer charges and improves application performance. 9. Automate Workload Scaling Use powerful auto-scaling mechanisms that adjust capacity based on real-time demand. This ensures you never pay for compute power you don’t need, especially during off-peak periods. 10. Optimize Container and Kubernetes Environments For container-based applications, use smart provisioning, efficient node selection, and right-sized compute environments. This ensures workloads run in the most cost-effective way possible. More Ways to Improve AWS Cost Efficiency Focus on Continuous Monitoring Track performance and costs regularly instead of waiting for monthly bills. Continuous monitoring flags problems early and supports long-term savings. Adopt Modern Architectures Shift to modern compute types, cost-efficient databases, and managed services that are designed to deliver better performance at lower prices. Use Data Analytics Smartly Query only necessary data, compress large datasets, and store hot vs cold data separately. This keeps your analytics workloads cost-efficient. Standardize Policies Across Teams Ensure every team follows the same rules for provisioning, tagging, security, and scaling. A unified strategy reduces waste and improves accountability. Review Costs Frequently Monthly or weekly reviews help identify new opportunities for savings, unused resources, or optimization gaps. Cost optimization is an ongoing practice, not a one-time task. QuickComparison: 35 Best AWS Cost Optimization Tools for 2026 Tool Name Type / Category Key Purpose / Benefit AWS Cost Explorer Cost Monitoring Visualise and analyze AWS usage & cost trends (AWS Documentation) AWS Budgets Budgeting / Alerts Set cost/usage budgets and get alerts (AWS Documentation) AWS Trusted Advisor (Cost Optimization) Recommendation Engine Detect cost-saving opportunities like idle or underutilized resources (AWS Documentation) AWS Savings Plans Recommendations Pricing / Commitment Suggests compute commitment plans to reduce costs AWS Instance Scheduler Automation Automatically start/stop EC2/RDS instances on a schedule AWS Compute Optimizer Rightsizing Machine learning-based rightsizing of compute & storage AWS Cost Anomaly Detection Monitoring / Alerting Use ML to detect unexpected spikes in AWS costs AWS Pricing Calculator Planning / Forecasting Estimate cost of future architecture before deploying Reserved Instance (RI) Utilization & Coverage Dashboard Reservation Management Track how well your RIs are being used and covered Amazon S3 Intelligent-Tiering Storage Optimization Automatically move S3 objects across access tiers to save cost (AWS Documentation) AWS Auto Scaling Scaling / Compute Automatically scale compute resources based on demand Amazon S3 Lifecycle Policies Storage Automation Define rules to transition or expire S3 objects AWS Lambda Power Tuning Serverless Optimization Tune Lambda memory for optimal cost vs performance AWS Organizations & Consolidated Billing Billing Management Centralize billing & share savings across accounts Amazon RDS Reserved Instances & Storage Optimization Database Commitment Use RIs + optimize DB storage costs AWS Service Quotas Governance Monitor
Top 35 AWS Cost Optimization Tools for 2026 Read More »